×
Please verify
Each day we overwhelm your brains with the content you've come to love from the Louder with Crowder Dot Com website.
But Facebook is...you know, Facebook. Their algorithm hides our ranting and raving as best it can. The best way to stick it to Zuckerface?
Sign up for the LWC News Blast! Get your favorite right-wing commentary delivered directly to your inbox!
EconomyApril 03, 2020
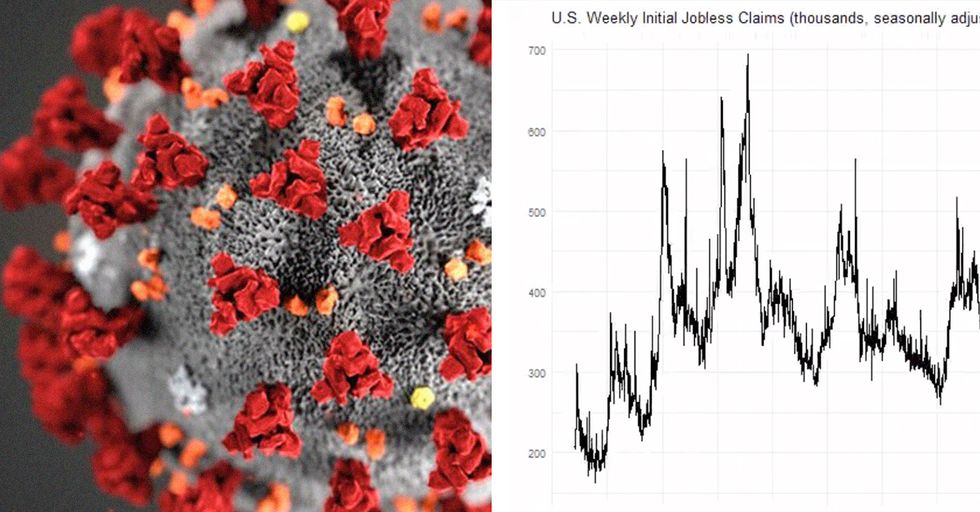
Unemployment Graph Through History Shows How Dire Our Situation is Now
Say whatever you want about how much I must hate old people and want them to die, because I care a lot about Americans losing their entire way of life over a cough. If the animation below is any indication of how dire this situation is, we're seriously screwed. A lot of people need to ask questions. At this point I don't care what questions, any questions will do. For here is a historical graph of unemployment numbers through the ages. Watch and feel sick.
When are we going to flatten THIS curve?
I know you people out there are screaming at me with such rational talking points like "Well, at least they're still alive!" then will turn around and tell me that I'm a heartless witch. What we're doing to our country is unacceptable. Millions of lives are being dramatically affected by this idea of a scary disease. And yes, sorry, but right now the idea of the virus is scaring people more than the actual virus, which seems to only take out the already very sick/old.
Go ahead. Tell me I'm terrible. Then go tell the man who just lost his job and can no longer support his family that if he complains, he hates old people. Go tell a person who's built up their business over years, and employs people that he or she must shut down and take it lest he or she hates old people and not to stay at home is to risk millions of lives (despite models being completely wrong).
Related: James O’Keefe Visits COVID-19 Testing Center, Talks to People on Frontlines and CONNED? Doctor Suggests COVID-19 Could be LESS Deadly Than Seasonal Flu.
Latest


